Here you will find a detailed explanation of each of the statistics related to both the patterns and the balls of the winning combination that LottoHub offers to you for each of the most important lotteries in the United Kingdom.
Our goal is to help you better understand the trends and patterns behind giveaway results. With practical examples, we will guide you through each statistic so you can apply this knowledge in your analysis of winning numbers.
Combination Patterns – Statistics
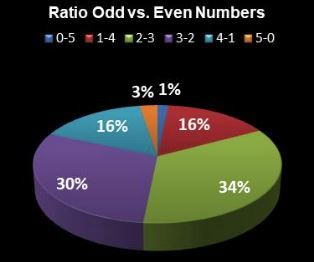
Ratio Odd-Even numbers
This shows the proportion of odd and even numbers in the winning combination for each selected draw range. For example, 2-16-22-34-46 is a combination with 5 even numbers, and therefore belongs to the 0-5 pattern of Odd-Even numbers in the chart shown below.
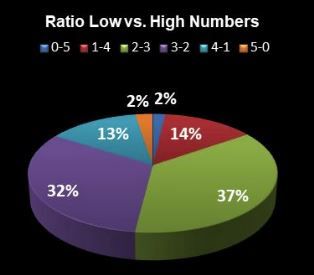
Ratio Low-High numbers
This shows the proportion of low and high numbers in the winning combination. In EuroMillions, for instance, there are a total of 50 main balls, numbered from 1 to 50, of which 5 are drawn to form the winning combination. Numbers whose value is less than 25 are considered ‘low numbers’, while those equal to or greater than 25 are classified as ‘high numbers’.
For example, consider the combination 7-20-32-41-43. In this combination, there are three high numbers and two low numbers. Therefore, this combination follows the 2-3 low-high pattern. In the statistical graph shown below, this pattern is represented with the green colour, indicating that 37% of the combinations in the particular range of selected draws (500, 250, 100 draws, etc.) follow this trend.
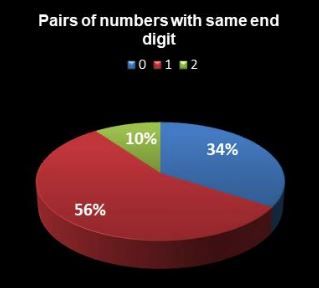
Pairs of numbers with same end digit
This shows the occurrence of pairs of numbers with the same ending digit. For example, consider the combination 10-13-23-30-45-46, which contains two different pairs of numbers that end in the same figure. These pairs are 13 and 23, which end in 3, and the number pair 10 and 30, which end in 0.
This combination is classified under the pattern ‘2’, indicating the presence of two pairs of numbers that share the same final digit. In the statistical graph shown below, this pattern is represented in green and represents 10% of the winning combinations in a particular range of draws.
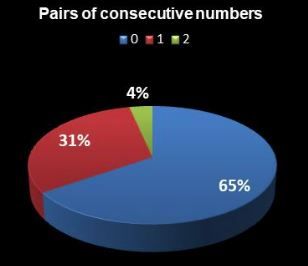
Pairs of consecutive numbers
This identifies the pairs of numbers that appear consecutively in the combination. For example, consider the combination 10-11-23-32-33-40, which contains two different pairs of consecutive numbers: 10 and 11, and the pair of numbers 32 and 33.
This combination is classified under the pattern “2” in the statistical graph shown below, which indicates that 4% of winning combinations contain two pairs of consecutive numbers.
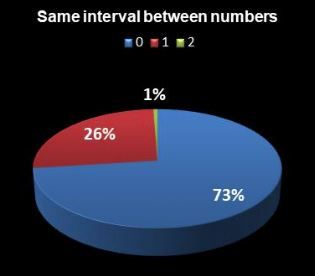
Same interval between numbers
This statistic shows the number of identical intervals between the numbers in the winning combination. For example, let’s consider the winning combination 10-20-25-35-41-43. The intervals between the numbers in this combination would be 10-5-10-6-2. From this sequence, we observe that there is only one equal interval, which is 10. Therefore, this situation is represented with the pattern “1” and is highlighted in red in the following graph, and represents in this case 42% of the winning combinations in a given range of draws.
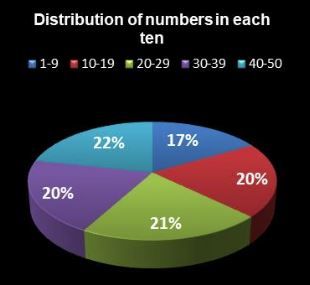
Distribution of numbers in each ten
This shows how numbers are distributed within specific tens. For example, let’s take the combination 20-21-22-40-41-42. 50% of the numbers in this combination belong to the range “20-29”, while the other 50% belong to the range “40-49”. The graph below shows the distribution of numbers in each ten for a given range of EuroMillions draws. There is a slight tendency for more numbers to appear that are in the ten 40-50 (22% of the drawn numbers belong to this ten).
Winning Balls – Statistics
Most – Less picked
This statistic reveals which numbers have appeared most and least frequently individually within a specific range of draws.
Most-less overdue
It indicates both the balls that have not appeared for the longest time and the balls that have appeared most recently.
Most common pair
This statistic indicates which pairs of numbers, whether consecutive or not, have appeared most frequently in a specific range of draws.
Most common triplets
It shows which trio of numbers (both consecutive and non-consecutive) have appeared most frequently in a given range of draws.
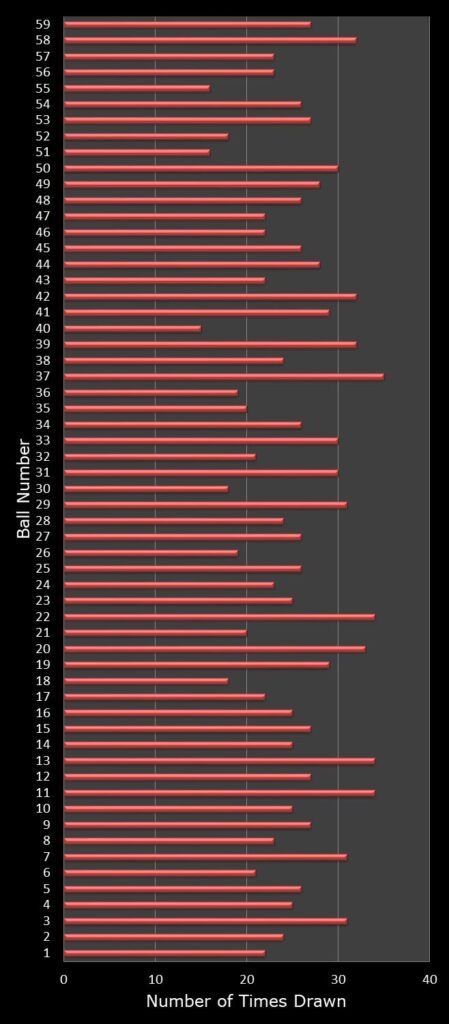
Number of times draw – Winning Numbers
“Winning Number Frequency” is an important statistic that shows how often each number has been selected as a winner in past draws. This information allows you to identify patterns and trends in sweepstakes results. For example, if a number has appeared frequently in previous draws, you may want to take this into account when choosing your numbers for the next draw. On the other hand, if a number has been rare, you might decide to include it in your bets, as it could be “due” to appear soon based on analysis of past frequencies.
Below is shown, as an example, the frequency of appearance of the winning numbers of the last 250 Lotto draws.