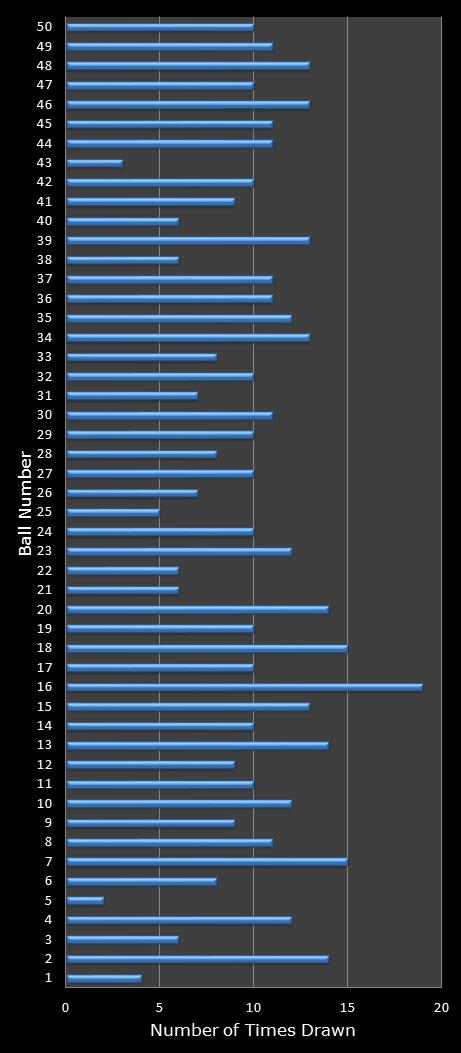
Number of Times Drawn – Winning balls
 |
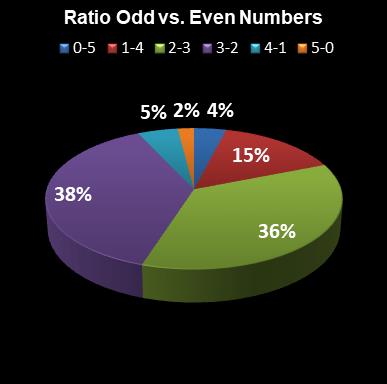
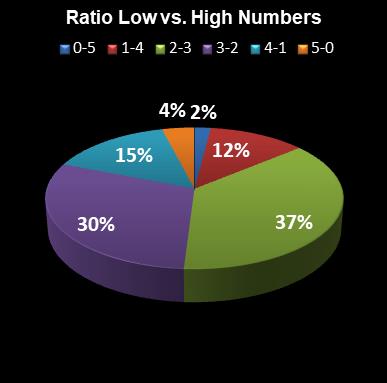
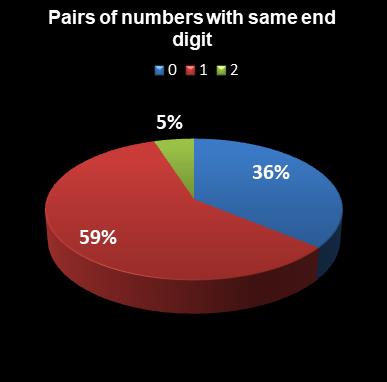
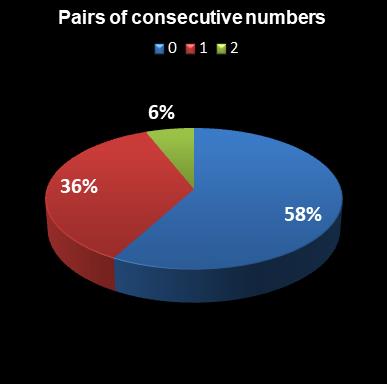
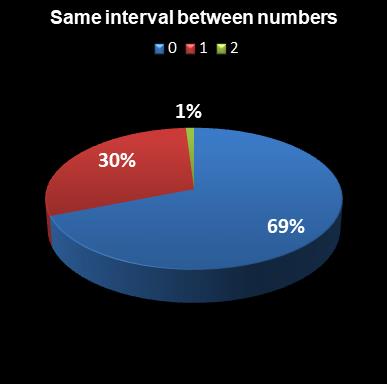
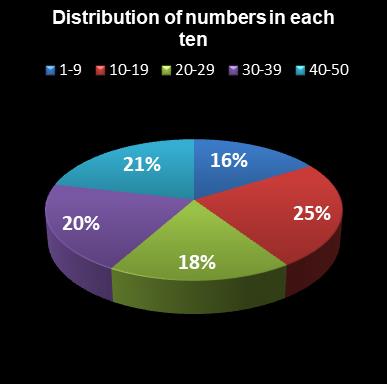
Combination Patterns – Statistics
 |
 |
 |
 |
 |
 |
Winning Balls – Statistics
Most Picked
Ball / Frequency
Less Picked
Ball / Frequency
Most Overdue
Ball / Draws
Less Overdue
Ball / Draws
| 16 | 19 | 5 | 2 | 43 | 39 | 4 | 0 | ||||
| 7 | 15 | 43 | 3 | 35 | 24 | 15 | 0 | ||||
| 18 | 15 | 1 | 4 | 28 | 23 | 23 | 0 | ||||
| 2 | 14 | 25 | 5 | 5 | 22 | 30 | 0 | ||||
| 13 | 14 | 3 | 6 | 13 | 17 | 39 | 0 | ||||
| 20 | 14 | 21 | 6 | 26 | 17 | 2 | 1 | ||||
| 15 | 13 | 22 | 6 | 50 | 16 | 32 | 1 | ||||
| 34 | 13 | 38 | 6 | 1 | 15 | 36 | 1 | ||||
| 39 | 13 | 40 | 6 | 3 | 14 | 48 | 1 | ||||
| 46 | 13 | 26 | 7 | 24 | 14 | 16 | 2 |
Most Common Pair
Pair / Frequency
Most Common Consecutive Pair
Pair / Frequency
| 4 | 7 | 4 | 35 | 36 | 4 | ||
| 35 | 36 | 4 | 13 | 14 | 3 | ||
| 2 | 13 | 3 | 16 | 17 | 3 | ||
| 8 | 11 | 3 | 39 | 40 | 3 | ||
| 9 | 12 | 3 | 41 | 42 | 3 | ||
| 12 | 16 | 3 | 2 | 3 | 2 | ||
| 13 | 14 | 3 | 3 | 4 | 2 | ||
| 14 | 34 | 3 | 15 | 16 | 2 | ||
| 15 | 17 | 3 | 17 | 18 | 2 | ||
| 16 | 17 | 3 | 20 | 21 | 2 |
Most Common Triplets
Triplet / Frequency
Most Common Consecutive Triplets
Triplet / Frequency
| 13 | 21 | 32 | 2 | 32 | 33 | 34 | 1 | ||
| 23 | 32 | 40 | 2 | ||||||
| 34 | 41 | 49 | 2 | ||||||
| 1 | 3 | 11 | 1 | ||||||
| 1 | 6 | 25 | 1 | ||||||
| 1 | 7 | 24 | 1 | ||||||
| 1 | 9 | 20 | 1 | ||||||
| 2 | 6 | 14 | 1 | ||||||
| 2 | 8 | 34 | 1 | ||||||
| 2 | 9 | 23 | 1 |

