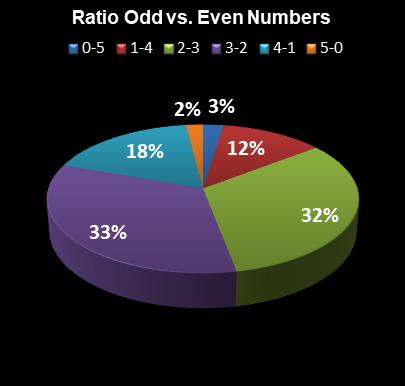
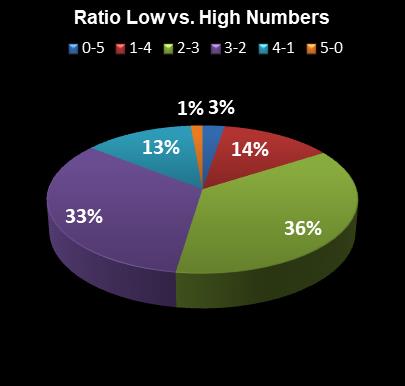
Combination Patterns – Statistics
 |
 |
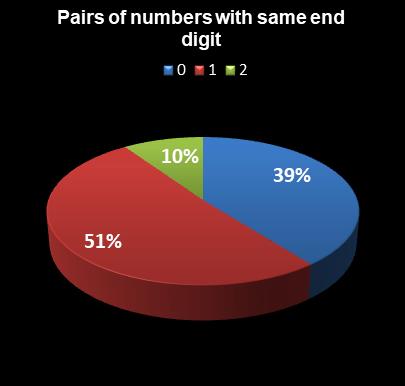 |
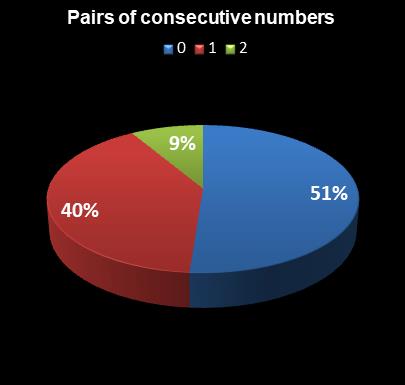 |
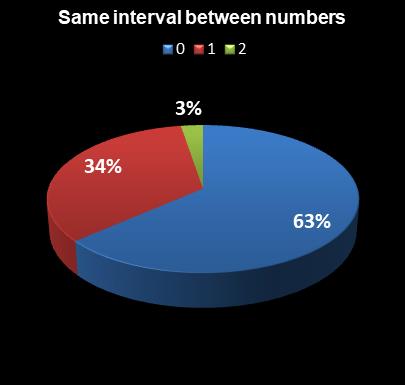 |
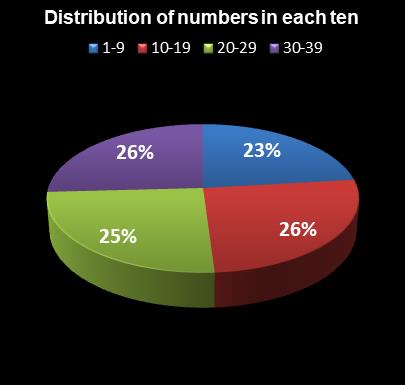 |
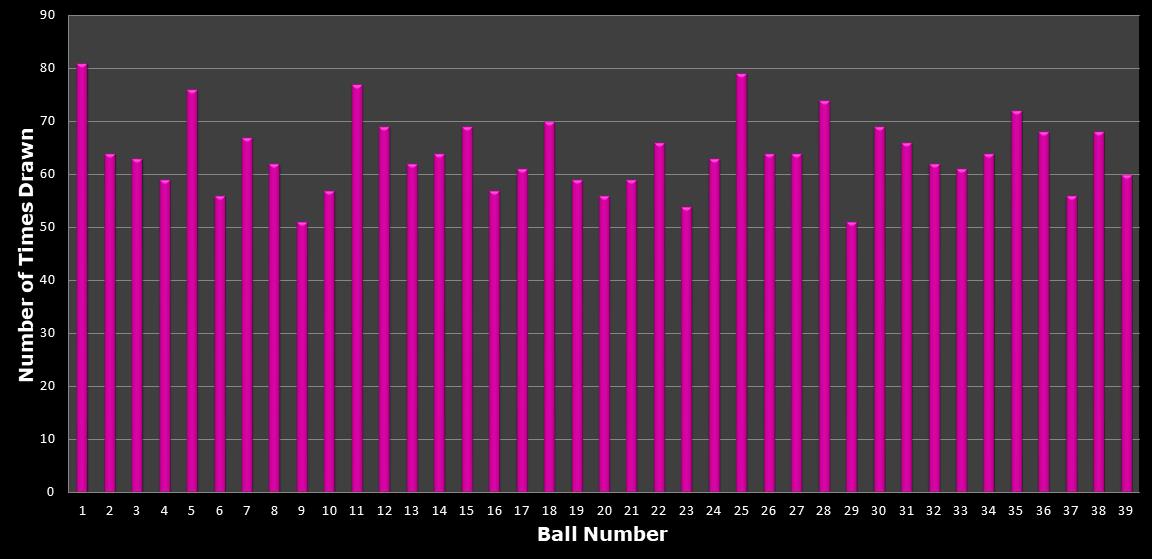
Winning Balls – Statistics
Most Picked
Ball / Frequency
Less Picked
Ball / Frequency
Most Overdue
Ball / Draws
Less Overdue
Ball / Draws
| 1 | 81 | 9 | 51 | 8 | 36 | 10 | 0 | ||||
| 25 | 79 | 29 | 51 | 21 | 16 | 32 | 0 | ||||
| 11 | 77 | 23 | 54 | 18 | 12 | 34 | 0 | ||||
| 5 | 76 | 6 | 56 | 15 | 11 | 35 | 0 | ||||
| 28 | 74 | 20 | 56 | 37 | 11 | 36 | 0 | ||||
| 35 | 72 | 37 | 56 | 1 | 10 | 12 | 1 | ||||
| 18 | 70 | 10 | 57 | 2 | 10 | 22 | 1 | ||||
| 12 | 69 | 16 | 57 | 20 | 9 | 29 | 1 | ||||
| 15 | 69 | 4 | 59 | 14 | 8 | 6 | 2 | ||||
| 30 | 69 | 19 | 59 | 39 | 8 | 23 | 2 |
Most Common Pair
Pair / Frequency
Most Common Consecutive Pair
Pair / Frequency
| 19 | 20 | 12 | 19 | 20 | 12 | ||
| 25 | 28 | 12 | 34 | 35 | 12 | ||
| 34 | 35 | 12 | 17 | 18 | 11 | ||
| 1 | 4 | 11 | 27 | 28 | 11 | ||
| 17 | 18 | 11 | 5 | 6 | 10 | ||
| 25 | 27 | 11 | 21 | 22 | 10 | ||
| 26 | 30 | 11 | 33 | 34 | 10 | ||
| 27 | 28 | 11 | 36 | 37 | 10 | ||
| 1 | 3 | 10 | 4 | 5 | 9 | ||
| 5 | 6 | 10 | 11 | 12 | 9 |
Most Common Triplets
Triplet / Frequency
Most Common Consecutive Triplets
Triplet / Frequency
| 25 | 26 | 30 | 4 | 10 | 11 | 12 | 2 | ||
| 28 | 34 | 35 | 4 | 33 | 34 | 35 | 2 | ||
| 5 | 12 | 16 | 3 | 37 | 38 | 39 | 2 | ||
| 10 | 14 | 19 | 3 | 7 | 8 | 9 | 1 | ||
| 11 | 12 | 17 | 3 | 8 | 9 | 10 | 1 | ||
| 11 | 13 | 20 | 3 | 11 | 12 | 13 | 1 | ||
| 12 | 16 | 17 | 3 | 12 | 13 | 14 | 1 | ||
| 15 | 17 | 18 | 3 | 15 | 16 | 17 | 1 | ||
| 16 | 19 | 26 | 3 | 16 | 17 | 18 | 1 | ||
| 16 | 21 | 30 | 3 | 17 | 18 | 19 | 1 |
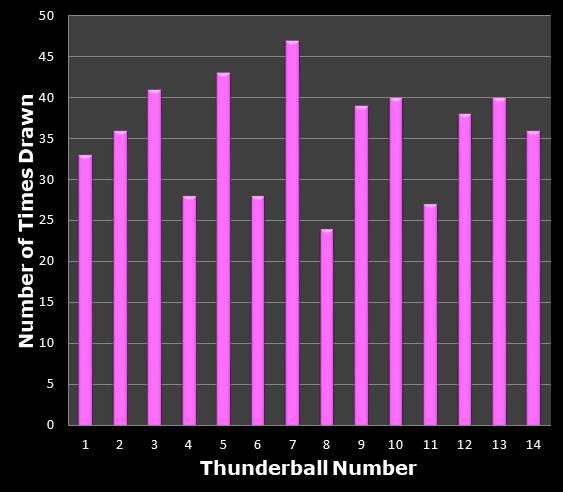
ThunderBall Bonus Ball – Statistics
Most Picked
Ball / Frequency
Less Picked
Ball / Frequency
Most Overdue
Ball / Draws
Less Overdue
Ball / Draws
| 7 | 47 | 8 | 24 | 9 | 56 | 12 | 0 | ||||
| 5 | 43 | 11 | 27 | 1 | 42 | 14 | 1 | ||||
| 3 | 41 | 4 | 28 | 8 | 32 | 7 | 2 | ||||
| 10 | 40 | 6 | 28 | 5 | 26 | 3 | 3 | ||||
| 13 | 40 | 1 | 33 | 6 | 18 | 13 | 5 | ||||
| 9 | 39 | 2 | 36 | 2 | 17 | 4 | 7 | ||||
| 12 | 38 | 14 | 36 | 11 | 10 | 10 | 8 | ||||
| 2 | 36 | 12 | 38 | 10 | 8 | 11 | 10 | ||||
| 14 | 36 | 9 | 39 | 4 | 7 | 2 | 17 | ||||
| 1 | 33 | 10 | 40 | 13 | 5 | 6 | 18 |


