
Click on the following link if you want to see a detailed explanation of each of our statistics related to both the patterns and the balls of the winning combination.
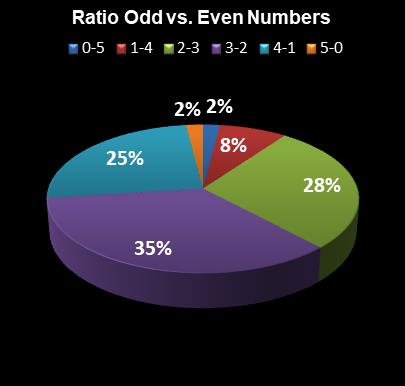
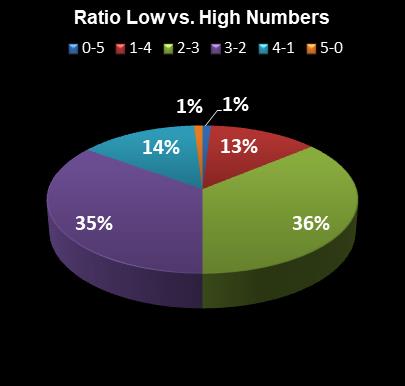
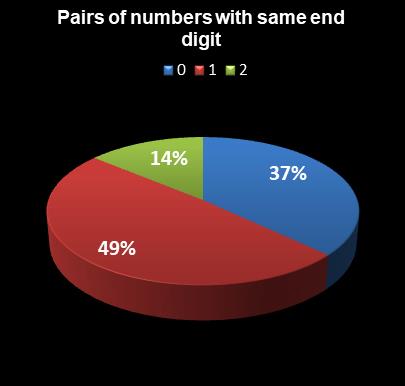
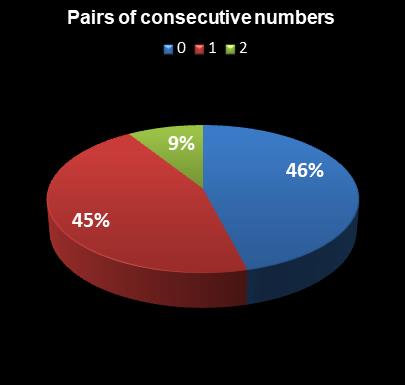
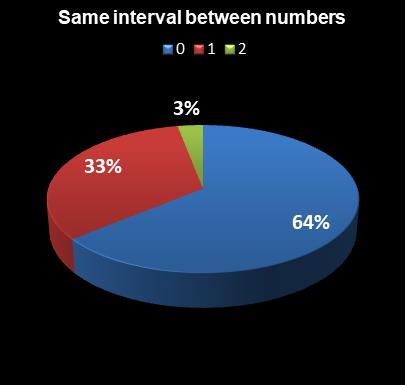
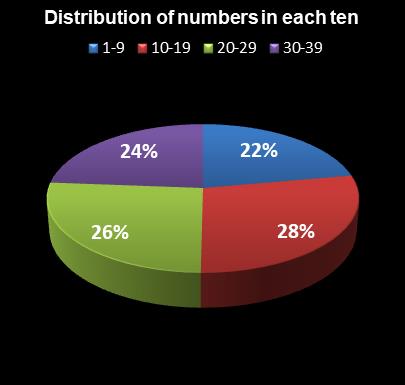
Combination Patterns – Statistics
 |
 |
 |
 |
 |
 |
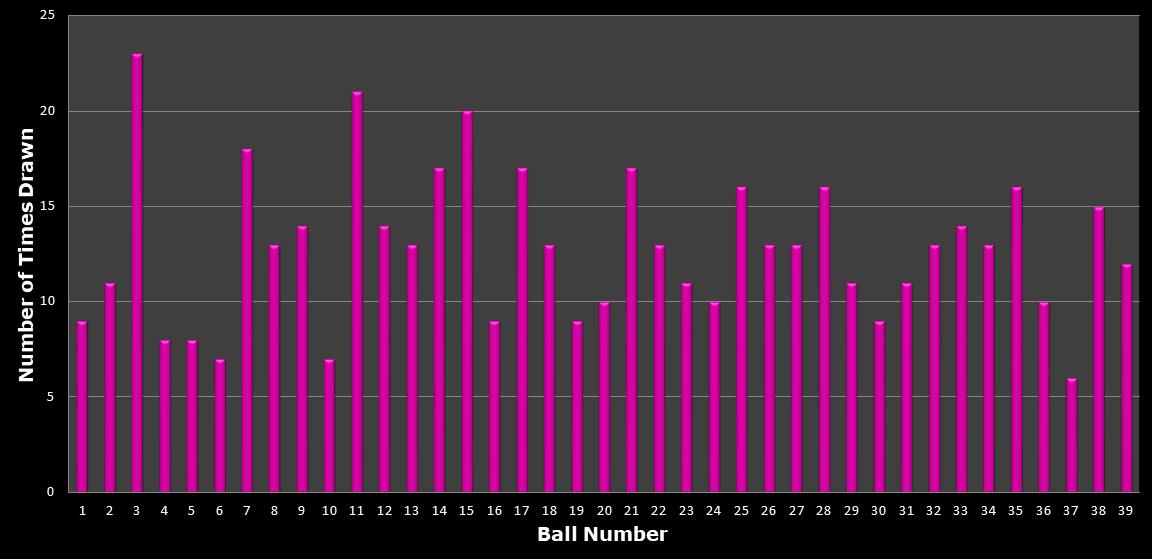
Winning Balls – Statistics
Most Picked
Ball / Frequency
Less Picked
Ball / Frequency
Most Overdue
Ball / Draws
Less Overdue
Ball / Draws
| 3 | 23 | 37 | 6 | 19 | 20 | 2 | 0 | ||||
| 11 | 21 | 6 | 7 | 4 | 17 | 3 | 0 | ||||
| 15 | 20 | 10 | 7 | 10 | 12 | 15 | 0 | ||||
| 7 | 18 | 4 | 8 | 8 | 11 | 22 | 0 | ||||
| 14 | 17 | 5 | 8 | 6 | 10 | 25 | 0 | ||||
| 17 | 17 | 1 | 9 | 17 | 10 | 1 | 1 | ||||
| 21 | 17 | 16 | 9 | 23 | 10 | 24 | 1 | ||||
| 25 | 16 | 19 | 9 | 35 | 10 | 33 | 1 | ||||
| 28 | 16 | 30 | 9 | 7 | 9 | 34 | 1 | ||||
| 35 | 16 | 20 | 10 | 26 | 9 | 9 | 2 |
Most Common Pair
Pair / Frequency
Most Common Consecutive Pair
Pair / Frequency
| 15 | 21 | 6 | 21 | 22 | 6 | ||
| 21 | 22 | 6 | 27 | 28 | 5 | ||
| 3 | 5 | 5 | 8 | 9 | 4 | ||
| 27 | 28 | 5 | 28 | 29 | 4 | ||
| 8 | 9 | 4 | 7 | 8 | 3 | ||
| 11 | 15 | 4 | 13 | 14 | 3 | ||
| 12 | 14 | 4 | 32 | 33 | 3 | ||
| 17 | 19 | 4 | 34 | 35 | 3 | ||
| 28 | 29 | 4 | 2 | 3 | 2 | ||
| 1 | 3 | 3 | 3 | 4 | 2 |
Most Common Triplets
Triplet / Frequency
Most Common Consecutive Triplets
Triplet / Frequency
| 8 | 19 | 20 | 2 | 10 | 11 | 12 | 1 | ||
| 12 | 19 | 20 | 2 | 11 | 12 | 13 | 1 | ||
| 12 | 21 | 25 | 2 | 19 | 20 | 21 | 1 | ||
| 12 | 25 | 28 | 2 | 26 | 27 | 28 | 1 | ||
| 19 | 20 | 23 | 2 | 33 | 34 | 35 | 1 | ||
| 19 | 26 | 28 | 2 | 34 | 35 | 36 | 1 | ||
| 1 | 2 | 6 | 1 | ||||||
| 1 | 3 | 5 | 1 | ||||||
| 1 | 3 | 19 | 1 | ||||||
| 1 | 4 | 11 | 1 |
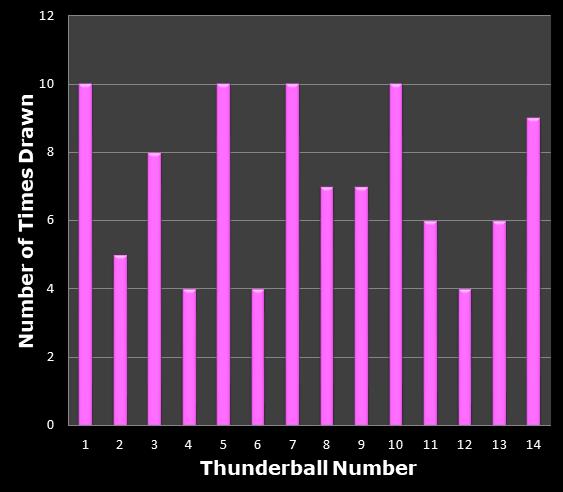
ThunderBall Bonus Ball – Statistics
Most Picked
Ball / Frequency
Less Picked
Ball / Frequency
Most Overdue
Ball / Draws
Less Overdue
Ball / Draws
| 1 | 10 | 4 | 4 | 9 | 31 | 7 | 0 | ||||
| 5 | 10 | 6 | 4 | 13 | 26 | 5 | 1 | ||||
| 7 | 10 | 12 | 4 | 1 | 17 | 11 | 2 | ||||
| 10 | 10 | 2 | 5 | 2 | 16 | 3 | 3 | ||||
| 14 | 9 | 11 | 6 | 12 | 14 | 8 | 7 | ||||
| 3 | 8 | 13 | 6 | 10 | 13 | 14 | 10 | ||||
| 8 | 7 | 8 | 7 | 4 | 12 | 6 | 11 | ||||
| 9 | 7 | 9 | 7 | 6 | 11 | 4 | 12 | ||||
| 11 | 6 | 3 | 8 | 14 | 10 | 10 | 13 | ||||
| 13 | 6 | 14 | 9 | 8 | 7 | 12 | 14 |